Direct Answer: Turn a spreadsheet from a place you store numbers into a tool that answers business questions reliably.
Tuition Fee
100% Free
Duration & Workload
~10 Hours
Curriculum Depth
12 Chapters · 48 Lessons
Credential Awarded
Verified Certificate
12Chapters
Course outline
Cell references, data types, and the structural habits that stop spreadsheets breaking.
Relative, Absolute, and Why $ Matters12 min
Data Types, Dates, and Dirty Data12 min
Building a Sheet That Others Can Use11 min
Sorting and Filtering Without Scrambling Your Data11 min
Conditional logic and aggregation — the everyday analytical workhorses.
IF, Nested Logic, and IFS12 min
SUMIFS, COUNTIFS, and Aggregation13 min
Text, Dates, and Useful Odds and Ends11 min
Percentages, Growth, and Rank12 min
Joining data across tables — the skill that separates casual users from analysts.
VLOOKUP and Why It Breaks12 min
XLOOKUP: the Modern Default12 min
Combining Data From Several Sheets11 min
When the Keys Do Not Match12 min
Summarising thousands of rows in seconds, and the settings that decide whether the answer is right.
PivotTable Fundamentals13 min
Charts That Tell the Truth12 min
What-If Analysis and Sanity Checks11 min
Pivot Layouts, Calculated Fields, and GETPIVOTDATA12 min
Automating the repetitive parts and communicating results so they change decisions.
Power Query: Stop Cleaning by Hand12 min
Dashboards People Actually Use11 min
Communicating Findings11 min
Comparing Periods Without Fooling Yourself12 min
Spill formulas, calculation speed, and how to take over a file that is already broken.
Dynamic Arrays: One Formula, Many Cells13 min
Why the Workbook Got Slow12 min
Taking Over a Workbook You Did Not Build12 min
LAMBDA: Naming Your Own Functions12 min
Data models, sharing files safely, and running a report other people depend on.
The Data Model: Relationships Instead of Lookups13 min
Sharing a File Without Leaking It12 min
The Monthly Run12 min
Connecting to a Live Data Source12 min
Writing M by hand, structuring queries so somebody else can follow them, and surviving the source changes that arrive with next month's file.
Reading and Writing M by Hand13 min
Custom Functions and a Staging Layer13 min
Schema Drift, Nulls, and Errors on Refresh Day13 min
The Formula Firewall and Other Refresh Failures13 min
Filter context, CALCULATE, and the model shapes that keep one measure correct at every level of a report.
Filter Context, Row Context, and Why a Measure Moves13 min
CALCULATE, ALL, and Removing Filters Deliberately13 min
Iterators: SUMX, RANKX, and Row-Level Maths13 min
Bridge Tables, Role-Playing Dates, and Ambiguous Paths13 min
Regression, forecasting, optimisation, and simulation for the business questions a summary table cannot answer.
Spread, Outliers, and the Average That Lies13 min
Correlation, Regression, and What LINEST Tells You13 min
Forecasting a Seasonal Series Honestly13 min
Solver and Monte Carlo: Deciding Under Uncertainty14 min
VBA that somebody can maintain, Office Scripts and Power Automate for runs nobody attends, and Python in Excel for the work formulas cannot do.
VBA Somebody Else Can Maintain13 min
Office Scripts: Automation That Runs in the Cloud13 min
Power Automate: A Run That Happens Without You13 min
Python in Excel and When It Beats a Formula13 min
Spreadsheet risk, formal review, shared standards, and moving a critical model onto stronger tools without losing the logic inside it.
How Spreadsheet Errors Become Expensive13 min
Testing a Model Before Anyone Trusts It13 min
Standards, Templates, and Analysis a Team Can Share13 min
Migrating Off Excel Without Losing the Logic13 min
Final exam & certificate
01
Topic checks
Each one opens the next topic
02
Chapter quizzes
Each one opens the next chapter
03
50-question final
50 of 100 marks to pass
04
Certificate
Issued instantly, verifiable
One attempt, 60 minutes. If you don't pass, you can retake once after 30 days.
The course guide
How to use Excel for data analysis: a beginner's roadmap
16 October 2026 · 11 min read
To use Excel for data analysis, you work in a fixed order: get the data into a clean table, answer questions with a small set of formulas (IF, SUMIFS, COUNTIFS, XLOOKUP), summarise it with a PivotTable, check the answer makes sense, and only then build a chart. Most people skip straight to the chart and the formulas, and that is where wrong numbers come from. The tools are not hard. The discipline is.
This guide walks through that order, the functions that do most of the real work, the mistakes that quietly break spreadsheets, and a realistic learning roadmap. It is built around our free Excel & Business Analytics course, which teaches all of it with one running sales dataset so each skill builds on the last.
Why Excel is still the place most data analysis starts
Python, SQL and Power BI get the attention, but in most offices in Pakistan the first place a number gets questioned is a spreadsheet. A sales manager in Lahore, an accountant in Karachi, a shop owner tracking stock on WhatsApp orders: they all send you an Excel file. If you can turn that file into a clear answer, you are useful on day one, before you know any programming.
Excel is also the best place to learn how analysis thinks. You can see every cell, every step, every mistake. That makes it a good teacher, even if you later move on to SQL for data analysis or a full data analyst bootcamp.
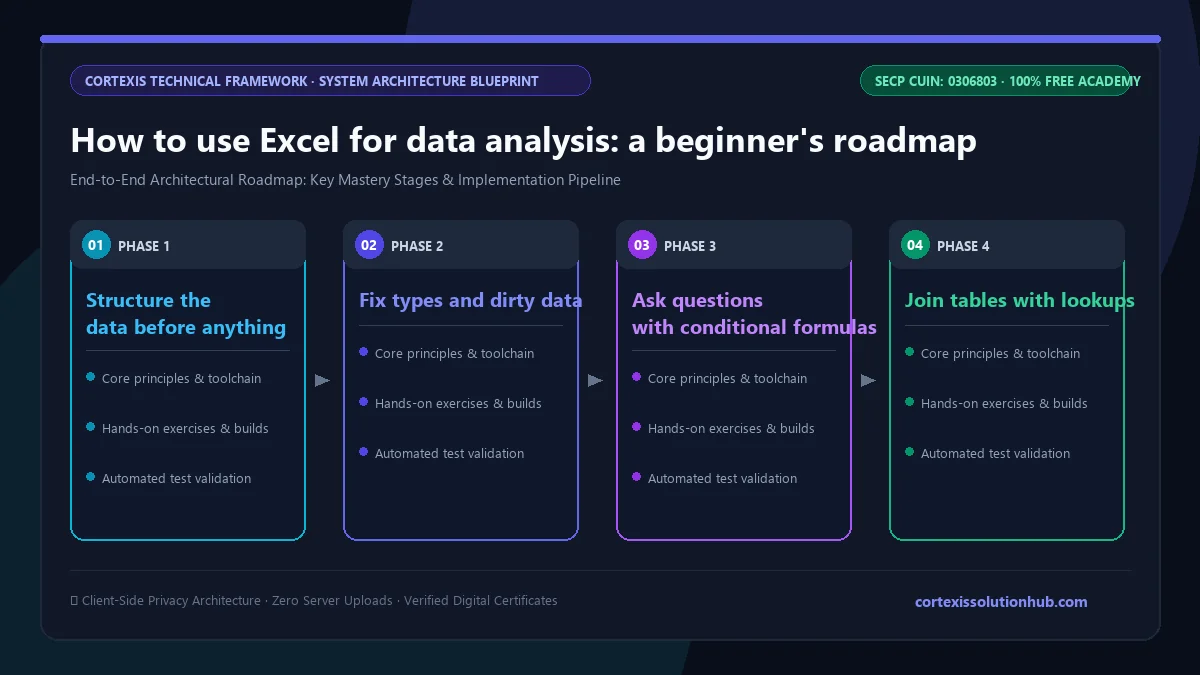
Figure 1: Complete step-by-step architectural workflow and technical execution stages for How to use Excel for data analysis: a beginner's roadmap.
How to use Excel for data analysis in six steps
Here is the order an experienced analyst follows, whatever the question.
1. Structure the data before anything else
Analysis fails at the data stage far more often than at the formula stage. Keep to three rules:
One fact per cell. "Ali Raza, Lahore" in one cell cannot be sorted by city.
Headers in row 1, data below, nothing else on the sheet. Summaries go on a separate sheet.
No blank rows inside the data. They break sorting, filtering and PivotTable ranges.
Then turn the range into an Excel Table (Ctrl+T). Tables grow when you add rows, so formulas and PivotTables pick up new data instead of silently ignoring it.
2. Fix types and dirty data
Numbers stored as text, dates that are really strings, trailing spaces in customer names: these are why a lookup returns nothing or a total looks too small. Check alignment (text sits left, numbers right), use TRIM and VALUE where needed, and look at the unique values in each column before you trust it.
3. Ask questions with conditional formulas
Most business questions are "how much, for which group?" That is SUMIFS and COUNTIFS:
It is the modern default. VLOOKUP still appears in old files, and it breaks when someone inserts a column, which is worth understanding before you inherit one.
5. Summarise with a PivotTable
A PivotTable turns thousands of rows into a summary in seconds: sales by city by month, top products, average order size. Drag fields into Rows, Columns and Values, and check the setting under Values (Sum, Count or Average) because the wrong one gives a confident, wrong answer.
6. Sanity check, then chart
Before you share anything, check that your PivotTable total matches the raw total, that counts look plausible, and that one odd row is not driving the result. Then pick the simplest chart that shows the point: a line for change over time, a bar for comparing groups. Start bar axes at zero.
The Excel functions that do most of the work
You do not need hundreds of functions. You need these, and you need to know when each one lies to you.
Task
Function or feature
Watch out for
Lock a reference when copying
$G$1 or a named range
Missing $ turns totals into zeros with no error
Category from a rule
IF, IFS
Nested IFs nobody can read
Total or count by group
SUMIFS, COUNTIFS
Text that looks like a number is skipped
Join two tables
XLOOKUP
Keys with extra spaces never match
Summarise many rows
PivotTable
Count instead of Sum, stale refresh
Growth between periods
Simple % change
Comparing months with different day counts
Repeatable cleaning
Power Query
Source columns renamed next month
Many results from one formula
FILTER, SORT, UNIQUE
A spill blocked by a cell in the way
Mistakes to avoid when analysing data in Excel
These come up again and again in real workbooks, and none of them shows an error message.
Forgetting the $. You write =C2*G1 for commission, copy it down, and every row below the first multiplies by an empty cell. The sheet shows zeros, not an error.
Typing a number that should be calculated. A hardcoded total is wrong the moment data changes.
Sorting one column instead of the whole table. Names and amounts get separated and nobody notices.
Trusting an average. One very large order can pull the average far from what a typical customer does. Look at the median and the spread too.
Comparing periods unfairly. A month with a holiday, or a shorter month, can look like a decline that is not real.
Cleaning by hand every month. If you repeat the same fixes each time a new file arrives, Power Query should be doing it.
A learning roadmap: what to learn, and in what order
Learn in layers. Each layer is useful on its own, so you can stop at the one your job needs.
Stage
What you learn
What you can do after it
Foundations
References, data types, clean structure, sorting and filtering
Build a sheet others can use without breaking it
Everyday analysis
IF, SUMIFS, COUNTIFS, text and date functions, lookups
Refresh a report in minutes instead of rebuilding it
Deeper analysis
DAX measures, regression, forecasting, Solver
Answer questions a summary table cannot
Production
VBA, Office Scripts, Power Automate, Python in Excel, model review
Run spreadsheets a business depends on
If your goal is a data analyst job, the first three stages plus Power Query cover a lot of what entry level roles ask about. Our guide on how to become a data analyst in Pakistan covers what to add after Excel.
What the free Excel & Business Analytics course covers
The course has 12 chapters and 48 topics, each a short reading of around 11 to 14 minutes with its own quiz. Every example uses the same sales dataset, so the formulas you write early are the ones you summarise, automate and model later.
Foundations That Prevent Errors. Relative and absolute references, data types and dirty data, building a sheet others can use, and sorting without scrambling rows.
Formulas That Do Real Work. IF and IFS, SUMIFS and COUNTIFS, text and date functions, percentages, growth and rank.
Lookups. VLOOKUP and why it breaks, XLOOKUP, combining data from several sheets, and what to do when keys do not match.
PivotTables and Analysis. PivotTable fundamentals, charts that tell the truth, what-if analysis and sanity checks, calculated fields and GETPIVOTDATA.
From Spreadsheet to Analysis. Power Query basics, dashboards people actually use, communicating findings, and comparing periods without fooling yourself.
Dynamic Arrays and Workbooks That Stay Fast. Spill formulas, why a workbook gets slow, taking over a file you did not build, and LAMBDA.
Excel in Production. The Data Model, sharing a file without leaking it, running the monthly report, and connecting to a live data source.
Power Query Beyond the Applied Steps. Writing M by hand, custom functions, a staging layer, and surviving refresh day failures.
Models That Answer Harder Questions. Filter context, CALCULATE and ALL, iterators like SUMX and RANKX, and bridge tables.
From Analysis to Decisions. Spread and outliers, correlation and regression with LINEST, seasonal forecasting, Solver and Monte Carlo simulation.
Automation Beyond the Recorded Macro. Maintainable VBA, Office Scripts, Power Automate, and Python in Excel.
When the Business Runs on Your Spreadsheet. Spreadsheet risk, testing a model, team standards, and migrating off Excel without losing the logic.
Chapters 7 and 9 overlap with Power BI, since the Data Model and DAX work the same way in both. If dashboards are your goal, the Power BI course is the natural next step.
Who it is for and how long it takes
The course is marked Beginner and starts from cell references, so you do not need prior experience. It suits students who want a practical skill for internships, office staff who already use Excel but keep hitting broken formulas, small business owners tracking sales and stock, and anyone preparing for a data analyst role.
We plan it as about six weeks at a steady pace, with roughly 10 hours of reading in total. Each topic stays open for at least 90 seconds before its quiz unlocks, and you need to pass a topic's quiz to move on, so it rewards reading properly rather than clicking through. You will get far more from it if you open Excel alongside and rebuild each example yourself.
One honest limit: reading about PivotTables does not make you good at them. Practice on a real file, ideally one from your own work or family business, is what turns the course into a skill.
How the free certificate works
The course ends in a final exam: 50 questions, 60 minutes, and a pass mark of 50 out of 100. You get one timed attempt. If you do not pass, a retake opens 30 days later with the same questions in a new order and the options shuffled. Leaving the page submits the exam, so pick a quiet hour. Pass, and the certificate is issued free.
The certificate shows you finished a structured course and passed a timed exam. It is not a Microsoft certification. Employers will be more convinced by a clean workbook you built and can explain in an interview. We wrote more about this in are free online certificates worth anything.
Questions, answered
06 questions
For many business questions, yes. Excel handles cleaning, lookups, summaries, charts and even regression and forecasting. It struggles with very large datasets and work that many people edit at once, which is where SQL, Power BI or Python take over.
Start with absolute references, IF, SUMIFS, COUNTIFS and XLOOKUP, then PivotTables. Those cover most everyday questions. Power Query and dynamic arrays like FILTER and UNIQUE come next.
The basics that make you useful at work can be learned in a few weeks of regular practice. Our free course is planned as about six weeks. The advanced chapters on DAX, forecasting and automation take longer to feel comfortable with.
The foundations, SUMIFS and PivotTables work in older versions. XLOOKUP and dynamic arrays need Excel 2021 or later (or Microsoft 365), and LAMBDA needs Excel 2024 or Microsoft 365. Python in Excel and Office Scripts also depend on Microsoft 365.
Excel first. Power BI builds on the same ideas: clean tables, relationships, and measures. Learning them in Excel, where you can see every cell, makes Power BI much easier to pick up.
Yes. All 12 chapters, the quizzes and the final exam are free, and the certificate is issued free when you pass. Start the [Excel & Business Analytics course](/learn/excel-business-analytics) whenever you are ready.