
10 min read
Direct Answer: How to become a data analyst in Pakistan with no degree in data: the skills in order, a realistic roadmap, portfolio projects, and how to get hired.
- How to become a data analyst in Pakistan with no degree in data: the skills in order, a realistic roadmap, portfolio projects, and how to get hired.
- Authored by Umair with actionable, zero-fluff implementation guidance.
- Verified for immediate practical application, production workflows, and professional skill enhancement.
To become a data analyst in Pakistan, learn four things in this order: how to turn a vague business question into a precise metric, spreadsheets, SQL, and how to explain a result to someone who did not ask for a chart. Python and dashboards come after that. Then build three portfolio projects from public data and apply. You do not need a computer science degree, and you do not need to start with machine learning. Our free Data Analyst Bootcamp follows exactly this order across 12 chapters.
What a data analyst actually does all day
A data analyst helps people make better decisions by turning raw records into clear answers. In a Pakistani company those records might be orders from an online store, calls to a support centre, students enrolled at an academy, or parcels moved by a courier. The answer might be one number, a chart, a short memo, or a dashboard a manager checks every morning.
The honest part: getting data into a trustworthy state usually takes longer than analysing it. You will find the same customer under three spellings and fix that before you can answer "why did returns jump in Karachi last week?" If that detective work sounds satisfying, you will enjoy the job.
It also helps to know what the role is not:
| Role | Main job | Typical tools |
|---|---|---|
| Data engineer | Builds the pipelines and warehouses that store data reliably | SQL, Python, cloud services |
| Data analyst | Queries that data to answer business questions | Spreadsheets, SQL, a BI tool, some Python |
| Data scientist | Builds predictive models and runs deeper statistics | Python, statistics, machine learning |
How to become a data analyst in Pakistan: the roadmap
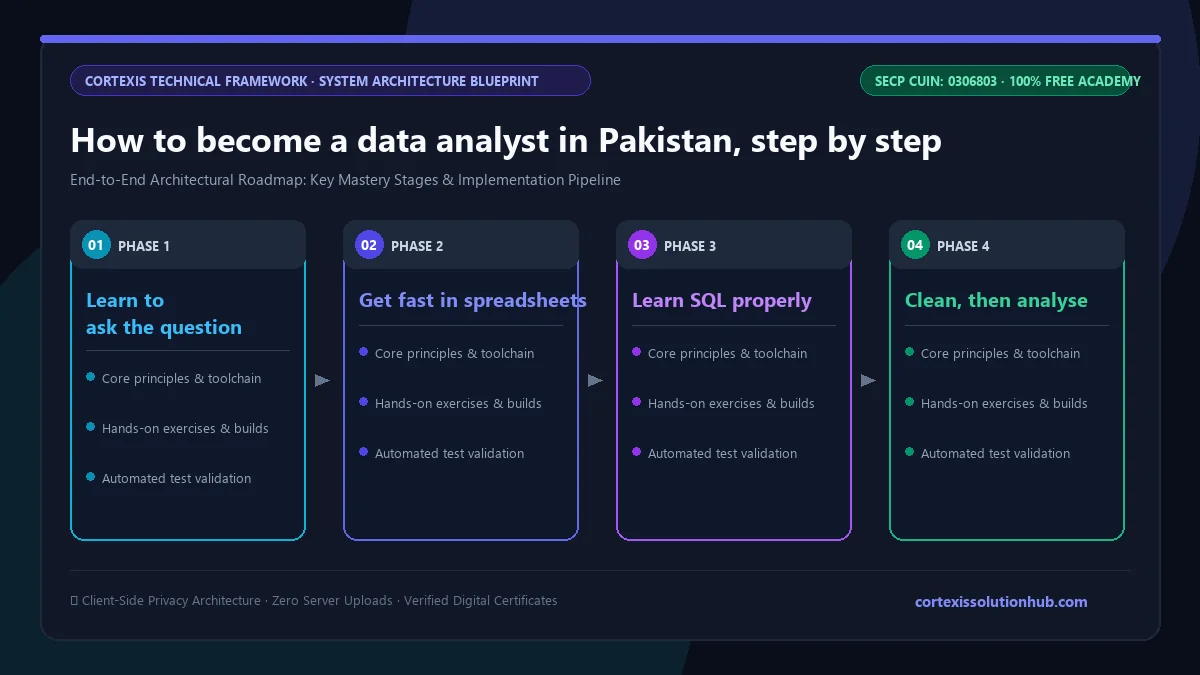
Here is the order that works, with a rough pace for someone studying an hour or two a day alongside a degree or a job.
| Weeks | Focus | You are ready to move on when |
|---|---|---|
| 1 | The role, the workflow, tidy tables | You can explain what one row in a table represents |
| 1 to 2 | Asking the right question | You can write a one-page analysis plan for a vague request |
| 2 to 3 | Spreadsheets | You can answer a question with a PivotTable in minutes |
| 3 to 4 | SQL | You can join two tables without duplicating rows |
| 4 | Cleaning data | You can profile a new file and document every fix |
| 5 | Statistics and exploratory analysis | You can explain why the median beat the mean in your data |
| 6 | Python and pandas | You can repeat a spreadsheet analysis in a notebook |
| 7 | Charts, dashboards, business methods | You can read an A/B test result without overclaiming |
| 8 | Communicating and getting hired | You have a memo, a portfolio and a CV that match |
Eight weeks is a pace for focused study, not a promise. Finish each stage with something you made, not something you watched.
Step 1: Learn to ask the question before touching the data
Most beginners skip this, and managers notice it first. "Can you look at sales?" is not a question. "Did average order value fall in September compared with August, and in which cities?" is. Pin down the metric, the period, the comparison and who will act on the answer.
Step 2: Get fast in spreadsheets
Excel or Google Sheets is where most analysis in smaller businesses here still happens. Learn daily formulas, lookups, PivotTables, and habits that let someone else audit your work. To go deeper, the free Excel & Business Analytics course pairs well.
Step 3: Learn SQL properly
SQL separates "good with Excel" from "analyst": filtering, GROUP BY, joins, then CTEs and window functions. Really understand joins that silently multiply rows, because they produce confident, wrong totals. SQL for Data Analysis gives you more practice.
Step 4: Clean, then analyse
Profile every new dataset before you trust it: rows, blanks, wrong types, dates stored as text. Handle missing values, duplicates and outliers deliberately and write down every step. Then move into statistics, segmentation, trends, cohorts and funnels.
Step 5: Add Python when the spreadsheet stops coping
You need Python when the file is too big or you need the same report every week, not on day one. If you have not picked a first programming language yet, our post on which programming language to learn first in Pakistan explains why Python is the natural choice for data work.
Step 6: Show the answer so people act on it
A chart should answer one question. An insight memo should lead with the recommendation, not the method. Practise writing a five sentence summary of every analysis you do.
What the free Data Analyst Bootcamp covers, chapter by chapter
The Data Analyst Bootcamp is rated Beginner to Intermediate and planned as eight weeks of study. It has 12 chapters and 48 lessons, each lesson followed by a short quiz and each chapter by a chapter quiz.
- The Data Analyst Role. What analysts do all day, the workflow from question to decision, tidy data, and how spreadsheets, SQL, Python and dashboards fit together.
- Asking the Right Questions. Turning a vague request into an analysis question, metrics and KPIs with precise definitions, stakeholders and scope, and a one-page analysis plan.
- Spreadsheets for Analysts. Daily formulas, lookups, PivotTables, and spreadsheet hygiene with audit trails.
- SQL for Analysts. Filtering and sorting, GROUP BY and aggregates, joins without duplicating rows, CTEs and window functions.
- Cleaning and Preparing Data. Profiling a dataset, missing values, duplicates and outliers, fixing types, dates and messy text, and documenting every step.
- Descriptive Statistics for Decisions. Mean versus median, spread and percentiles, correlation versus causation, and samples with margins of error.
- Exploratory Analysis. Segmenting groups, trends and seasonality, cohorts and retention, funnels and conversion rates.
- Python and pandas for Analysts. Python essentials, loading and grouping with pandas, merging and reshaping DataFrames, charts with matplotlib and seaborn.
- Data Visualisation and Dashboards. Choosing the right chart, removing clutter, avoiding misleading charts, and dashboards people actually use.
- Business Analysis Methods. A/B tests, simple forecasting you can defend, root cause analysis when a metric drops, and unit economics such as CAC, LTV and margin.
- Communicating Insights. Structuring a data story, writing an insight memo, presenting to non-technical audiences, and handling pushback and uncertainty.
- Getting Hired as a Data Analyst. A portfolio from public data, CV and LinkedIn, SQL tests and case interviews, and remote and freelance analyst work from Pakistan.
Each topic has to stay open for 90 seconds before you can mark it read and take its quiz, and a chapter's quiz must be passed before the next chapter opens. That stops the click-through habit.
Build a portfolio that gets you interviews
For entry-level analyst roles, a portfolio often matters more than the name on your degree. Three strong projects beat ten copied tutorials. A strong project has:
- A real question, written at the top, that a business might actually ask.
- Messy public data you cleaned yourself, with the cleaning steps written down.
- One clear answer, a chart or two, and a short recommendation.
- Honest limits: what the data cannot tell you.
Use government open data portals or Kaggle, and pick topics close to home, such as product prices or cricket statistics. You ask sharper questions about things you understand.
For dashboards, the free Power BI & Business Intelligence course is a natural next step.
How hiring works for analysts here
Junior analyst hiring usually means a CV screen, a practical test that is very often SQL, and an interview. Case interviews ask you to reason aloud: "orders dropped this week, how would you investigate?" A structured answer (check the data, segment by city, channel and product, look for a recent change) is what they want.
Remote work is real too: foreign employers, employer of record platforms, freelance marketplaces, and Pakistani firms with foreign clients. Freelance clients ask for outcomes, such as merging messy Excel files or a sales dashboard, so package a fixed scope. A backup for load shedding matters as much as skills.
Mistakes to avoid
- Starting with machine learning. It feels advanced and skips the skills analyst jobs actually test.
- Trusting data you have not profiled. One duplicated join can double your revenue figure.
- Confusing correlation with cause. Two numbers rising together does not mean one caused the other.
- Charts with no question. If you cannot say what a chart answers in one sentence, remove it.
- Copying tutorial projects. Reviewers have seen the same Titanic notebook many times.
How the free certificate works
When every lesson is done and every quiz passed, the final exam unlocks: 50 questions, 60 minutes, and a pass mark of 50 out of 100. You get one timed attempt. If you do not pass, a retake opens 30 days later, with the same questions in a new order and the options shuffled. Leaving the page submits the exam, so choose a quiet hour. Pass it and the certificate is issued free.
The certificate shows you finished a structured course and passed a timed exam. It does not replace a degree where an employer requires one. We wrote more about this in are free online certificates worth anything. In analyst hiring, the certificate gets you noticed and the portfolio and SQL test get you the job.
Questions, answered
06 questions
Yes. Analyst work rewards SQL, spreadsheets and clear communication, and people arrive from commerce, economics and engineering. Some employers still list a degree, so a strong portfolio matters even more without one.
The bootcamp is planned as eight weeks, with about ten hours of lesson reading plus quizzes and your own practice. Expect a few more months for portfolio projects and applications.
Not at first. Many junior roles mainly use spreadsheets, SQL and a BI tool, which is why the course teaches Python in chapter 8, after SQL and cleaning.
You need both, but SQL is what most analyst tests check. Start with spreadsheets because they are easier, then put serious practice into SQL.
Yes. Start with narrowly packaged services such as dashboards or file cleanup, show matching portfolio samples, and never put a client's data in your portfolio.
Yes. The lessons, quizzes, final exam and certificate are all free. You need an account to track progress and sit the exam. Ready to start? Open the free [Data Analyst Bootcamp](/learn/data-analyst-bootcamp), begin with chapter one, and keep a messy spreadsheet of your own beside you the whole way.