

10 min read
Direct Answer: How to learn Power BI for free, step by step. Power Query, star schema models, DAX, dashboards, sharing and PL-300 prep, with a free 12 chapter course.
- How to learn Power BI for free, step by step. Power Query, star schema models, DAX, dashboards, sharing and PL-300 prep, with a free 12 chapter course.
- Authored by Umair with actionable, zero-fluff implementation guidance.
- Verified for immediate practical application, production workflows, and professional skill enhancement.
You can learn Power BI for free, and you do not need to pay for software to start. Power BI Desktop is a free Windows download, and it is where all the real building happens: cleaning data in Power Query, designing the data model, writing DAX and laying out report pages. Learn those four skills in that order, practise on one realistic dataset, and finish with a portfolio project. The only parts that usually cost money are sharing reports inside a company and sitting the Microsoft exam, and you need neither to become good.
This guide gives you the order to learn things in, the mistakes that slow most beginners down, and a realistic timeline. It follows the structure of our free Power BI & Business Intelligence course, which teaches everything with one running example: a grocery chain with branches in Karachi, Lahore, Islamabad and Faisalabad that is tired of emailing Excel files to head office every night.
What Power BI actually is, and what is free
Power BI is not one program but a small family of tools.
| Tool | What it does | Cost to learn with |
|---|---|---|
| Power BI Desktop | Connect, clean, model, write DAX, design reports | Free, Windows only |
| Power BI Service | Publish, share, schedule refresh, secure | Free account for your own My workspace (sign up needs a work or school email); sharing with others generally needs paid licences |
| Power BI Mobile | View published reports on phones and tablets | Shows what the Service shares with you |
Microsoft now positions Power BI as part of Microsoft Fabric, so you will see that name around, but the report building skills are the same. Licence rules and prices change, so check Microsoft's own pricing page rather than any blog, this one included.
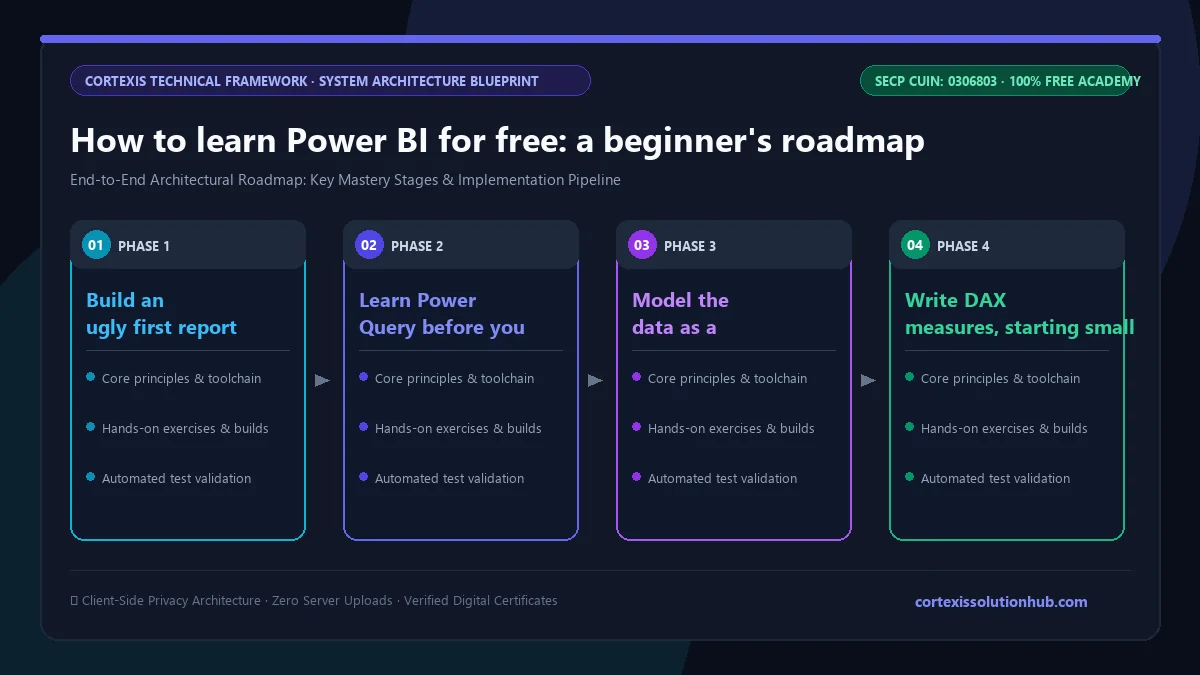
How to learn Power BI for free in six steps
The order matters more than the speed. Most people who struggle with Power BI skipped step three.
1. Build an ugly first report on day one
Install Desktop, load a small sales spreadsheet and drag a few fields onto the canvas. Click a bar and watch the other visuals filter. Twenty minutes of this shows you what the finished thing looks like, so every later topic has a place to hang.
2. Learn Power Query before you learn charts
Real data is messy. Dates arrive as text, prices contain "Rs", some customers appear twice and a numeric column has "N/A" in it. Power Query fixes all of this through menus and records every action as a repeatable step, so next month's file is cleaned the same way automatically.
Learn to connect to files and folders, set types, handle nulls and errors, remove duplicates, unpivot a spreadsheet with one column per month, and merge and append tables. Power Query lives inside Excel too, so Excel users will feel at home. Our guide on how to use Excel for data analysis covers that side.
3. Model the data as a star schema
This is the step people skip, and it is the reason their totals are wrong and their DAX is painful. Separate fact tables (the sales lines, one row per event) from dimension tables (products, branches, customers, dates). Connect them in a star shape, with one to many relationships and filters flowing from the dimensions to the facts. Then build a proper date table, because the time intelligence functions you want later work best with one. Microsoft's own guidance recommends this shape, and once it is right, most measures become short and obvious.
4. Write DAX measures, starting small
DAX is the formula language. Start with measures, not calculated columns, and with the basic aggregations: SUM, AVERAGE, COUNTROWS and DISTINCTCOUNT. Then spend real time on the two ideas that explain almost everything DAX does: row context and filter context. After that, learn CALCULATE, the main tool for changing the filter context, and then the time comparisons managers ask for constantly: year to date, previous year, growth, rolling averages and running totals. Use variables and DIVIDE from the start, so a colleague can read your measures in six months.
5. Design reports that answer one question per page
Start from the reader's question and choose the simplest visual that answers it. Bars, lines, cards and tables do most of the work. Add slicers, drill through and tooltips so managers can investigate on their own instead of asking you for a new report every week.
6. Publish, share and secure
Publish to the Power BI Service, learn the difference between a report, a dashboard and an app, set up scheduled refresh, and learn row level security so each branch manager sees only their own branch. Even if you cannot share widely on a free licence, understand how it works, because interviewers ask.
A realistic learning roadmap
The course is designed for about six weeks of steady part time study. Here is a sensible split if you study an hour or two most days.
| Week | Focus | You can do this by the end |
|---|---|---|
| 1 | Desktop tour, first report, Power Query basics | Load and clean a messy Excel file |
| 2 | Shaping, unpivoting, merging, a first look at M | Combine a folder of monthly files into one table |
| 3 | Fact and dimension tables, relationships, date table | Build a clean star schema |
| 4 | DAX fundamentals, CALCULATE, time intelligence | Write YTD, previous year and percent of total measures |
| 5 | Visuals, interactivity, dashboard design | A sales dashboard a manager can use alone |
| 6 | Service, refresh, RLS, performance, portfolio | A published portfolio project you can explain |
New to data entirely? Add a week or two at the start.
Mistakes that slow beginners down
- One giant flat table. It works until you need a time comparison or a second fact table. Model properly from the start.
- Cleaning in Excel by hand first. You will redo it next month. Clean in Power Query so it repeats.
- Calculated columns for everything. Most totals belong in measures, which are smaller and respond to filters.
- Copying DAX you cannot explain. Learn filter context properly and the formulas start to make sense.
- Using every visual on offer. Eleven chart types on one page answer nothing.
- Only watching videos. Open Desktop and do each skill yourself at least once.
What the free Power BI course covers, chapter by chapter
The Power BI & Business Intelligence course is rated beginner to intermediate and runs to 12 chapters of 4 lessons each, 48 lessons in total, with short quizzes after every lesson.
- Business Intelligence and Power BI. What BI is, the Desktop, Service and Mobile family, installing Desktop, and a first report in twenty minutes.
- Getting Data In With Power Query. Excel, CSV and folder connections, applied steps, cleaning messy data, and databases and the web.
- Shaping Data Like a Pro. Custom and conditional columns, unpivoting, merging and appending, and a first look at M.
- Data Modelling Foundations. Facts and dimensions, the star schema, relationships and filter direction, and a proper date table.
- DAX Fundamentals. Columns versus measures, core aggregations, row and filter context, and variables with DIVIDE.
- CALCULATE and Time Intelligence. Changing filter context, percent of total, year to date and growth, and rolling averages.
- Visuals That Communicate. Choosing visuals, everyday charts done well, the decomposition tree, and colour and accessibility.
- Interactive Reports. Slicers, cross filtering, drill through and tooltips, and bookmarks and navigation.
- Dashboards for Decision-Makers. Choosing KPIs, layout, conditional formatting, and a complete sales dashboard.
- Publishing and Sharing in the Power BI Service. Workspaces, reports versus apps, scheduled refresh and gateways, and licences.
- Security, Performance and Governance. Row level security, Performance Analyzer, storage modes, and governance.
- Careers, Portfolio and PL-300. Real business uses, an end to end portfolio project, PL-300 preparation, and getting hired or freelancing.
Who this is for
Excel users tired of rebuilding the same pivot table every Monday, accounts and operations staff who want reports that update themselves, students aiming for analyst roles, and freelancers. No programming needed; comfort with spreadsheets helps.
If you want the wider analyst toolkit, pair it with SQL for data analysis, since most company data lives in databases, or take the broader data analyst bootcamp. Our post on how to become a data analyst in Pakistan explains where Power BI fits in that career.
The free certificate, and the PL-300 exam
When every lesson is done and every quiz passed, the final exam unlocks: 50 questions, 60 minutes, and a pass mark of 50 out of 100. You get one timed attempt. If you do not pass, a retake opens 30 days later with the same questions in a new order and the options shuffled. Leaving the page submits the exam, so choose a quiet hour. Pass it and the certificate is issued free.
Our certificate is not a Microsoft certification. That is the Power BI Data Analyst Associate, earned by passing the paid PL-300 exam. Chapter 12 maps the course to the four PL-300 skill areas with a study plan built on Microsoft Learn's free learning paths and practice assessment. Either way, a portfolio project you can walk an interviewer through counts for more than any certificate.
Start learning Power BI today
Install Power BI Desktop, find a messy spreadsheet from your own work or studies, and open the first lesson of the free Power BI & Business Intelligence course. By the end you will have a published dashboard you built from raw data and can explain line by line, which is exactly what an employer or client wants to see.
Questions, answered
05 questions
Yes. Power BI Desktop is free to download and use on Windows, and it covers data cleaning, modelling, DAX and report design. Our course, quizzes, final exam and certificate are free too. Paid licences mostly matter when you need to share reports with colleagues in the Power BI Service.
The course is planned for about six weeks of part time study. That gets you to building a clean model, writing everyday DAX and publishing a solid dashboard. DAX keeps rewarding practice long after that, so treat six weeks as a strong start, not the finish line.
It helps but is not required. Excel users pick up Power Query quickly because it exists in Excel too. The bigger adjustment is DAX, which works on whole columns and tables rather than single cells, so some Excel habits need unlearning.
Desktop runs on Windows only. On a Mac, run Windows in a virtual machine, use a separate Windows PC, or build some reports in the browser through the Service, which needs a work or school account to sign in.
No. Ours is free and shows you completed the course and passed its timed exam. PL-300 is Microsoft's paid exam for the Power BI Data Analyst Associate certification. The last chapter of the course helps you prepare for it if you choose to sit it.