
10 min read
Direct Answer: How to learn SQL for data analysis from your first SELECT to joins, CTEs and window functions, with an 8 week plan, common mistakes and a free course.
- How to learn SQL for data analysis from your first SELECT to joins, CTEs and window functions, with an 8 week plan, common mistakes and a free course.
- Authored by Umair with actionable, zero-fluff implementation guidance.
- Verified for immediate practical application, production workflows, and professional skill enhancement.
To learn SQL for data analysis, install a free database such as PostgreSQL, load one small dataset you understand, and learn the language in this order: SELECT and WHERE, then aggregation with GROUP BY, then joins, then CTEs and window functions. At every step, check your answer against something you can count by hand. The syntax takes a few weeks. Learning to notice when a query returns a confident, wrong number is the real skill, and it is the part most tutorials skip.
This guide gives you an 8 week roadmap, the mistakes that catch almost every beginner, and a chapter by chapter look at our free SQL & Data Analysis course, which teaches all of it on one small store database so every lesson builds on the one before.
Why SQL is the core skill for data analysis
Spreadsheets are where most analysis starts, and they stay useful. But once the data lives in a company database, someone has to ask that database a question in its own language. That language is SQL, and its core has stayed stable for decades, so what you learn now keeps paying off.
A query is written down, so someone else can read it, rerun it next month and check your logic. That is why analyst roles so often list it, and why our guide on how to become a data analyst in Pakistan puts it straight after spreadsheets.
You do not need to be a programmer. SQL is declarative: you describe the result you want, and the database works out how to get it. If you can build a PivotTable, you already think in the right shapes.
What you need before you start
Very little:
- A laptop. Anything that runs a modern browser will do.
- A free database. PostgreSQL is free and open source, and it is what the course uses for most examples. SQLite is even lighter: a single file, no server. The course points out where MySQL and SQLite behave differently, for example in case sensitivity and in how strictly GROUP BY is enforced.
- One dataset you understand. Customers, orders and products is ideal, because you already know what the right answer should look like.
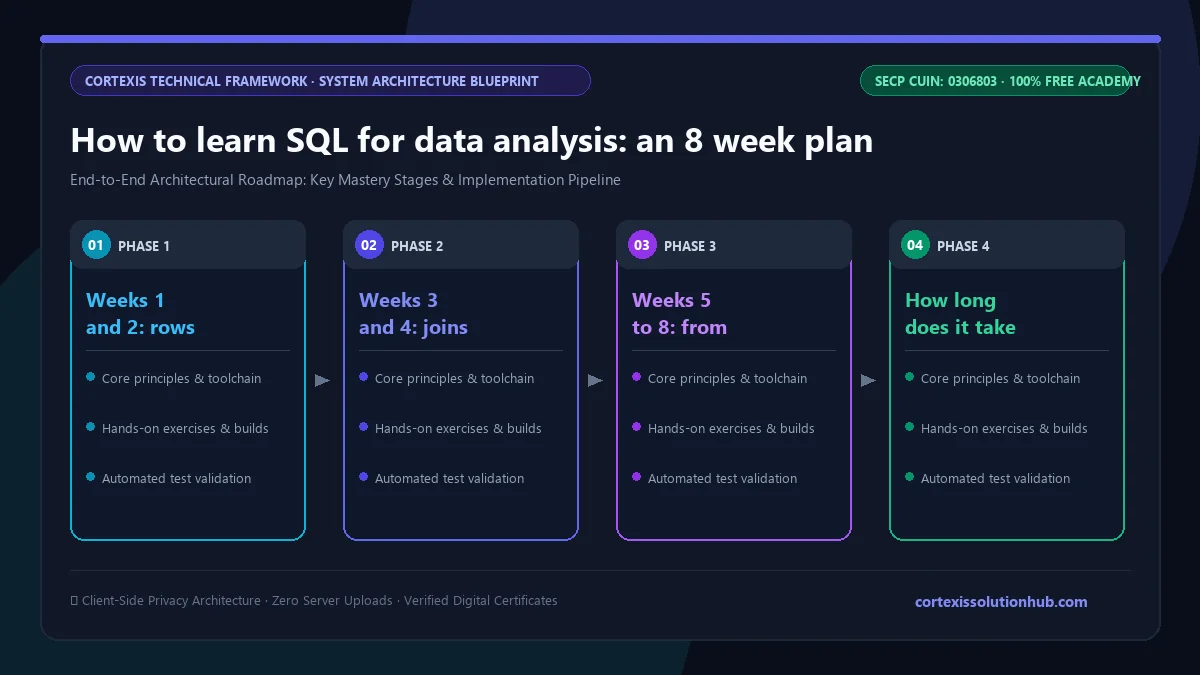
How to learn SQL for data analysis: an 8 week roadmap
Plan on about an hour a day, five days a week.
| Week | Focus | You can answer |
|---|---|---|
| 1 | Tables, keys, SELECT, WHERE, ORDER BY, NULLs, dates | "Which orders were placed in June?" |
| 2 | COUNT, SUM, AVG, GROUP BY, HAVING, medians | "Revenue per category, only categories above a threshold" |
| 3 | INNER, LEFT and other joins, anti-joins, self-joins | "Which customers have never ordered?" |
| 4 | Subqueries, CTEs, window functions | "Each customer's running total and rank" |
| 5 | Cleaning messy data, indexes, query plans, constraints | "Why does this report take minutes?" |
| 6 | INSERT, UPDATE, DELETE, transactions, safe reloads | "Can I fix this data without breaking it?" |
| 7 | Views, data tests, ROLLUP, funnels, retention cohorts | "Monthly retention by signup cohort" |
| 8 | Practice project and review | A written analysis someone else can rerun |
Weeks 1 and 2: rows into answers
Start with the shape of a table: one row states one fact about one thing, and keys connect tables to each other. Then filter and sort. Spend real time on NULL, because WHERE city <> 'Lahore' quietly drops every customer whose city is missing, and nothing warns you.
Aggregation comes next. Learn exactly what COUNT(*) counts compared with COUNT(column), and why a filter on individual rows belongs in WHERE while a filter on a group's total belongs in HAVING. Learn the median too, because a single huge order can drag an average far away from what a typical customer spends.
Weeks 3 and 4: joins and windows
Joins are where wrong answers come from. When you join orders to order items, each order appears once per line item, so summing the order total afterwards counts it several times. Revenue looks healthy and is simply false. The fix is to aggregate the line items to one row per order first, then join.
After joins, CTEs let you name each step of a query so you can test them one at a time. Window functions then let you rank, compute running totals and compare a row with the previous one without collapsing your rows. Many analyst interview questions live here.
Weeks 5 to 8: from correct to dependable
Analysts who last learn why a query is slow, how to clean text and dates inside SQL, how to change data without regret, and how to write tests that fail loudly when the data goes wrong. Finish with one project: a question about your store data, the queries that answer it, and a short write-up of what you found and what you could not prove.
Common mistakes to avoid
These are the ones the course builds whole lessons around:
- The join that doubles revenue. Always check the row count before and after a join. If it grew and you did not expect it to, stop.
- BETWEEN on timestamps.
BETWEEN '2024-06-01' AND '2024-06-30'misses almost all of the last day when the column holds times. Use>= '2024-06-01' AND < '2024-07-01'instead. - Integer division. In PostgreSQL, 4 / 6 is 0. Multiply by
100.0first when you want a percentage. - Filtering on a window function in WHERE. Window functions run after WHERE, so wrap the query in a CTE and filter outside it.
- Building SQL by gluing strings together. In an application, pass values as bound parameters. Escaping quotes by hand is how SQL injection happens.
- Trusting a number you never checked. Pick one customer, count their orders by hand, and confirm your query agrees.
What the free SQL & Data Analysis course covers
The SQL & Data Analysis course is rated Beginner to Intermediate and planned as 8 weeks of study. It has 12 chapters of 4 lessons each, 48 lessons in all, and most lessons take about 12 to 15 minutes to read. Every example uses the same four tables: customers, products, orders and order items.
| Chapter | What you learn |
|---|---|
| 1. Thinking in Tables | Keys, SELECT, WHERE, ORDER BY, NULLs, text and dates, UNION and EXCEPT |
| 2. Aggregation: Rows Into Answers | COUNT, SUM, AVG, GROUP BY, HAVING vs WHERE, medians and percentiles |
| 3. Joining Tables | Every join type, fan-out, anti-joins, self-joins, range joins |
| 4. Subqueries, CTEs, and Window Functions | EXISTS, named steps, ranking, running totals, moving averages |
| 5. Clean Data, Fast Queries, Good Schemas | Cleaning in SQL, indexes, query plans, normalisation, constraints |
| 6. Changing Data Safely | INSERT, UPDATE, DELETE, transactions, UPSERT, live schema changes |
| 7. Putting a Query Into Production | Views, data tests, SQL inside applications, finding slow queries |
| 8. Questions That Do Not Fit a GROUP BY | ROLLUP, LATERAL joins, recursive CTEs, funnels and retention cohorts |
| 9. Why the Planner Chose That Plan | Statistics, join algorithms, partial and covering indexes, rewrites |
| 10. Concurrency Under Real Traffic | MVCC, isolation levels, locks, deadlocks, VACUUM |
| 11. Big Tables, Warehouses, and the Bill | Partitioning, column stores, scan cost, approximate counts |
| 12. The Numbers the Company Runs On | Star schemas, slowly changing dimensions, backfills, metric contracts |
Chapters 1 to 4 are the core of analyst SQL. Chapters 5 to 8 make you the person whose numbers others trust. Chapters 9 to 12 go further than most analyst roles need on day one, into the territory where analysis meets data engineering, so treat them as a second pass once the basics are solid.
Who this course is for, and who it is not for
It suits students, Excel users who keep hitting the limits of their spreadsheets, and junior analysts who can write a query but are not sure they trust the result. It assumes no programming background.
It is not a full analyst career path on its own. If you also want spreadsheets, statistics and presenting results, the Data Analyst Bootcamp covers that wider ground. If you are still more comfortable in spreadsheets, our guide on how to use Excel for data analysis and the Excel for Business Analytics course are a gentler start. Once your queries work, Power BI & Business Intelligence turns them into dashboards.
How the free certificate works
Each lesson ends with a short quiz you pass to open the next lesson, and each chapter ends with a chapter quiz. You need 70 percent on a chapter quiz to open the next chapter, so you cannot skim ahead without the foundations.
When every lesson is complete and every chapter quiz is passed, the final exam unlocks: 50 questions, 60 minutes, and a pass mark of 50 out of 100. You get one timed attempt. If you do not pass, a retake opens 30 days later. Pass it and your certificate is issued free.
Be honest with yourself about what that certificate proves. It shows you finished a demanding course and passed a timed exam. An employer will learn more from a short project where you explain a query, the check you ran on it, and the mistake you caught.
Questions, answered
06 questions
The basics of SELECT, GROUP BY and joins take a few weeks of steady practice. Our course is planned as 8 weeks at about an hour a day. Becoming genuinely reliable, where you catch your own wrong numbers, comes from using it on real questions after that.
Yes. PostgreSQL and SQLite are free to install, and the SQL & Data Analysis course, its quizzes, the final exam and the certificate are all free on Cortexis.
PostgreSQL is a strong choice because it follows standard SQL closely and is free. The course uses it for most examples and notes where MySQL and SQLite differ, so the skills transfer.
Usually not on its own. Most analyst roles also expect spreadsheets, some statistics and the ability to explain a result clearly. SQL is the part that most often separates candidates, so it is worth learning well.
No. SQL is a separate, smaller language and many analysts learn it first. Python becomes useful later for statistics and automation, but it is not a prerequisite for this course.
Window functions calculate across related rows without collapsing them, for example a running total per customer or a rank within each category. Analysts use them constantly, and they come up often in interviews. Ready to start? Open the free [SQL & Data Analysis](/learn/sql-data-analysis) course, run your first SELECT on the store database, and check every answer against one row you can count by hand.