11Models in Production: Scoring, Monitoring, and Drift
12Causal Questions, Experiments, and Decisions
Final exam
Certificate
48 topics · ~11h
Accredited Curriculum & Certification
Official Syllabus Snapshot
Direct Answer: Turn messy real-world data into a defensible answer — NumPy, pandas, cleaning, EDA, charts that do not lie, and statistics you can actually explain.
Tuition Fee
100% Free
Duration & Workload
~11 Hours
Curriculum Depth
12 Chapters · 48 Lessons
Credential Awarded
Verified Certificate
12Chapters
Course outline
Arrays, dtypes, broadcasting, and the aggregation habits every pandas operation is built on.
The ndarray: dtype, Shape, and Views12 min
Vectorisation and Broadcasting14 min
Aggregation, Axes, NaN, and Random Sampling13 min
Sorting, Searching, and Set Operations13 min
Precise indexing, split-apply-combine, joins that do not silently duplicate rows, and tidy data.
Series, DataFrames, and Precise Indexing13 min
groupby: Split, Apply, Combine14 min
Merging, Concatenating, and Reshaping14 min
Window Operations: shift, rolling, and Cumulative Work14 min
Missing values, broken types, duplicate entities, outliers, and a pipeline that fails loudly.
Missing Values and Why They Are Missing13 min
Types, Duplicates, and Messy Text13 min
Outliers and a Pipeline That Fails Loudly14 min
Reading Files That Fight Back: Encodings, Delimiters, and Excel13 min
A repeatable EDA routine, matplotlib you control, and choosing a chart that tells the truth.
An EDA Routine That Finds Things13 min
matplotlib You Actually Control13 min
Choosing a Chart — and Not Lying With It14 min
seaborn: Statistical Charts in One Line13 min
Distributions, correlation and confounding, confidence intervals, p-values, and reporting a result you can defend.
Descriptive Statistics and Distributions13 min
Correlation, Sampling, and Confidence Intervals14 min
Hypothesis Testing and Reporting Honestly15 min
Regression You Can Explain15 min
Profiling before you optimise, dtype-driven memory cuts, chunked and columnar IO, and pushing work down into SQL.
Profile First: Finding the Line That Costs You13 min
Memory: dtypes, Categories, and Accidental Copies14 min
Bigger Than RAM: Chunks, Parquet, and Pushing Work into SQL14 min
Parallelism: When More Cores Actually Help14 min
Project layout, pinned environments, tests for data code, contracts that catch drift, and debugging the run that failed overnight.
A Project Someone Else Can Run13 min
Testing Data Code14 min
Contracts, Logging, and Debugging the 3 a.m. Failure15 min
Notebooks in Git, Linting, and CI13 min
Time zone and calendar bugs, resampling onto a regular grid, seasonality and autocorrelation, and forecasts judged by rolling origin rather than one lucky split.
Timestamps, Time Zones, and the Calendar Bugs Underneath13 min
Resampling, Gaps, and Aligning Series That Do Not Line Up13 min
Trend, Seasonality, and Autocorrelation13 min
Baselines, Backtesting, and Forecasts That Do Not Cheat14 min
Designing the holdout before you touch anything, encoding and scaling inside a pipeline that only ever fits on training rows, and the leakage that makes a mediocre model look brilliant.
Holdout Design: Random, Grouped, and Time-Based Splits13 min
Encoding Categories, Scaling Numbers, and Turning Dates Into Features13 min
Pipelines and ColumnTransformer: Fit on Train Only14 min
Hunting Leakage: Target, Temporal, and Group14 min
An honest baseline first, metrics tied to the decision the model actually serves, tuning that does not quietly overfit the validation set, and explanations a stakeholder can act on.
Baselines First, Then Linear Models and Gradient Boosting13 min
Metrics, Thresholds, and Calibrated Probabilities13 min
Cross-Validation and Tuning Without Fooling Yourself13 min
Error Analysis and Explanations a Stakeholder Trusts13 min
Shipping a model with the features it expects, scoring in batch or behind an API without training and serving diverging, watching for drift when the labels arrive weeks late, and retraining without teaching the model its own output.
Packaging the Model and the Features It Expects13 min
Batch Scoring, an API, and Training-Serving Skew13 min
Monitoring Drift When the Labels Arrive Late13 min
Retraining, Rollback, and Feedback Loops14 min
Separating what predicts from what causes, designing an experiment with the power and guardrails to settle the question, estimating an effect when randomisation is impossible, and owning the recommendation that follows.
Prediction or Intervention: Naming the Real Question13 min
Designing an Experiment: Power, Guardrails, and Not Peeking14 min
When You Cannot Randomise: Matching, Difference-in-Differences, and Sensitivity14 min
Fairness, Privacy, and the Decision You Put Your Name On14 min
Final exam & certificate
01
Topic checks
Each one opens the next topic
02
Chapter quizzes
Each one opens the next chapter
03
50-question final
50 of 100 marks to pass
04
Certificate
Issued instantly, verifiable
One attempt, 60 minutes. If you don't pass, you can retake once after 30 days.
The course guide
Data science roadmap: what to learn, and in what order
16 October 2026 · 10 min read
A sensible data science roadmap runs in this order: Python, then NumPy and pandas, then cleaning messy data, then exploring it with charts, then statistics, and only after that machine learning. Most of the job is the middle of that list. People who skip straight to models usually end up with a confident answer built on a broken join, and nobody notices until the number reaches a manager.
Below is the order we would follow, what each stage is actually for, how long it tends to take, the mistakes that waste the most time, and how our free Data Science with Python course lines up with it chapter by chapter.
What data science work actually looks like
Before you plan a roadmap, be clear about the destination. A data scientist takes a question someone cares about ("did the new delivery fee hurt repeat orders?") and turns raw, untidy data into an answer they can defend. That means pulling data, fixing it, looking at it properly, measuring uncertainty, and sometimes building a model.
It also helps to know the neighbouring roles, because many people searching for a data science roadmap would be happier in one of them.
Role
Day to day
Start with
Data analyst
Dashboards, reports, answering business questions with SQL and spreadsheets
SQL, Excel or Power BI
Data scientist
Cleaning, analysis, statistics, experiments, some predictive models
Python, pandas, statistics
Machine learning engineer
Training, shipping and maintaining models in production
Python, software engineering, ML
Data engineer
Pipelines that move and store data reliably
SQL, Python, cloud tools
If the first row sounds like you, a data analyst path is shorter and the hiring bar for juniors is usually lower. If the second row is the one, keep reading.
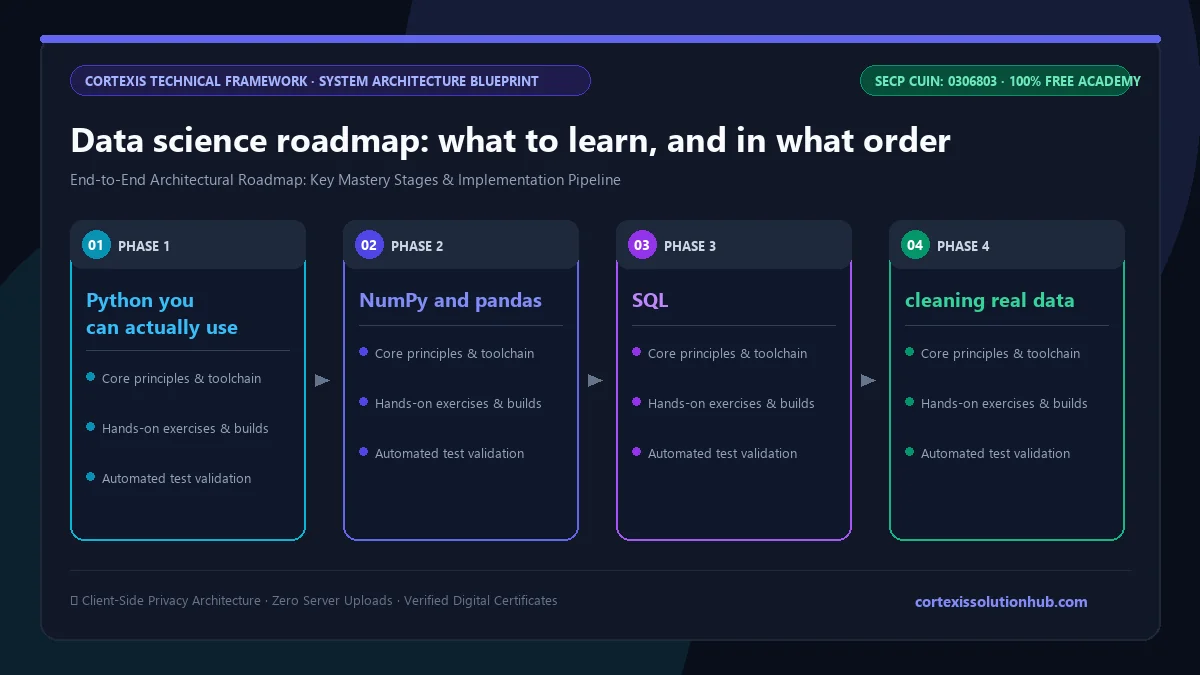
Figure 1: Complete step-by-step architectural workflow and technical execution stages for Data science roadmap: what to learn, and in what order.
The data science roadmap, step by step
Each stage depends on the one before it. You can move fast through a stage you already know, but do not skip it.
Stage 1: Python you can actually use
You need functions, loops, lists, dictionaries, reading files, and the patience to read an error message to the end. You do not need classes, decorators or async code at this point. If Python itself is new, do our Python development course first. Trying to learn the language and pandas at the same time is the most common reason people stall in month one.
Stage 2: NumPy and pandas
NumPy teaches you to think in whole arrays instead of loops, and pandas is where you will spend most of your working hours. Learn indexing precisely, groupby, merging, reshaping between wide and long tables, and window operations like rolling averages. The skill that matters here is not memorising methods. It is knowing when an operation silently changed your data: a merge that duplicated rows, a groupby that dropped the ones with missing keys.
Stage 3: SQL
Data at work lives in databases. Learn SELECT, WHERE, GROUP BY, JOIN and window functions well enough to pull your own data. Our SQL for data analysis course covers exactly this, and you can run it alongside stage 2.
Stage 4: cleaning real data
Real files arrive with missing values, numbers stored as text, the same customer spelled four ways, broken encodings and Excel sheets with merged headers. Learn why values are missing before you fill them, because the reason changes the right fix. Build cleaning steps that fail loudly when something unexpected arrives rather than quietly passing bad rows through.
Stage 5: exploratory analysis and honest charts
Have a routine you run on every new dataset: shape, types, missing values, distributions, obvious outliers, relationships between columns. Then learn matplotlib properly and seaborn for quick statistical plots. Learn which chart answers which question, and how charts mislead: a truncated axis, two y axes that imply a relationship, a 3D pie chart where the front slice looks bigger than it is.
Stage 6: statistics you can explain
This is where data science stops being data wrangling. Distributions, correlation and confounding, sampling, confidence intervals, hypothesis tests, and regression. The goal is to say what a result means in plain words, including how unsure you are. If you cannot explain what a p-value is and is not, you are not ready to report one.
Stage 7: modelling, carefully
Only now do models make sense. Start with a dumb baseline, then linear models and gradient boosting, measured with a metric tied to the real decision. Learn holdout design and data leakage before anything fancy. Our separate post on how to learn machine learning from scratch goes deeper on this stage.
Stage 8: the work around the analysis
Reproducible projects, tests for data code, time series, experiments and causal questions. This is what turns a notebook that worked once into work a team can trust and rerun next month.
How long the roadmap takes
Honest answer: it depends on where you start and how many hours you have, so treat these as rough ranges for steady part time study, not promises.
Starting point
Rough time to reach stage 6
Already comfortable in Python
Around two months
Some programming, new to Python
Three to four months
No programming at all
Add a few months for Python first
Mistakes that cost beginners months
Starting with deep learning. Neural networks are exciting, but they are rarely what a junior role asks you to do first.
Collecting courses instead of finishing one. Three half finished courses teach less than one finished course and one project.
Using only clean tutorial datasets. The famous practice datasets have already been cleaned for you. Download something messy from a government open data portal or a public data site and fix it yourself.
Trusting a merge without checking row counts. Count rows before and after every join. A join on a key that is not unique can multiply revenue, and the code will not complain.
Reporting a number without its uncertainty. "Sales rose 4 percent" means little if the interval runs from minus 2 to plus 10.
Never writing anything up. Employers read your analysis, not your notebook cells. A short written summary of what you found, how sure you are and what you would do next is worth more than another model.
What the free Data Science with Python course covers
Data Science with Python is an intermediate course with twelve chapters of four topics each, planned as roughly eight weeks of study. It assumes you already write basic Python. Every chapter is built around a specific kind of silent error you learn to catch.
Chapter
What you learn
1. NumPy and the Vectorised Mindset
dtypes, shape, views versus copies, broadcasting, aggregation, sorting and set operations
2. pandas: Series, DataFrames, and Reshaping
precise indexing, groupby, merging and reshaping, shift and rolling windows
3. Cleaning Real Data
why values are missing, types and duplicates, outliers, files with bad encodings and Excel quirks
4. Exploratory Analysis and Visualisation
an EDA routine, matplotlib you control, choosing honest charts, seaborn
5. Statistics and Honest Communication
distributions, correlation and confidence intervals, hypothesis testing, regression you can explain
6. Performance, Memory, and Data That Does Not Fit
profiling, memory cuts with dtypes, chunks and Parquet, pushing work into SQL, parallelism
7. From Notebook to Reproducible Pipeline
project layout, testing data code, contracts and logging, notebooks in Git and CI
8. Time Series and Forecasts You Can Defend
time zones and calendar bugs, resampling, seasonality, backtesting against baselines
9. Feature Engineering and the Leakage Trap
random, grouped and time based splits, encoding and scaling in pipelines, hunting leakage
10. Supervised Models and Validation That Holds Up
baselines, linear models and boosting, metrics and thresholds, cross validation, error analysis
11. Models in Production
packaging a model, batch scoring and APIs, drift monitoring, retraining and rollback
12. Causal Questions, Experiments, and Decisions
prediction versus intervention, experiment design, matching and difference in differences, fairness and privacy
Chapters 1 to 5 match stages 2 to 6 of the roadmap above. Chapters 6 to 12 cover stages 7 and 8, the part most free material leaves out.
It is not for everyone. If you have never written Python, start with the Python course. If you mainly want dashboards for a business, a data analyst or Power BI path will get you there faster.
How the course and certificate work
Each topic has a minimum reading time of 90 seconds before its quiz opens, and you need 70 percent on that quiz to unlock the next topic. Each chapter ends with a chapter quiz, and the next chapter opens only once you pass it.
The final exam opens after every lesson is complete and every chapter quiz is passed: 50 questions, 60 minutes, one timed attempt, and a pass mark of 50 out of 100. If you fail, a retake opens 30 days later with the questions and options reshuffled. Passing gives you a free certificate with a verification code and QR code anyone can check. Be realistic about its weight; we wrote honestly about that in are free online certificates worth anything. A project you can walk someone through will always count for more.
Python first, then NumPy and pandas, SQL, data cleaning, exploratory analysis and charts, statistics, and only then machine learning. Finish each stage with a small project on a real, messy dataset before moving on.
You need comfort with averages, spread, percentages and reading a graph. Statistics is the maths that matters most, and you can learn it as you go. Linear algebra and calculus help later for machine learning, but intuition is enough to start.
Both work. Python is the more common choice in industry data roles and is used well beyond data work, which is why our course uses it. If your university or team already uses R, learning it is not a mistake.
Yes. The lessons, quizzes, final exam and certificate are all free. You need an account to track your progress and sit the exam.
It is possible but harder than the advertisements suggest. Junior roles are competitive, and employers look for projects that show you can clean data, analyse it and explain the result. Courses give you the skills; projects and a clear write up are what you show.